Research shows that lack of reading proficiency has a long-lasting impact on future educational attainment, future earnings, and more.
To support researchers and advocates promoting state-wide early literacy plans, the Equitable Analysis team used the Virginia Department of Education data on the state's English Standards of Learning (SOL) assessment to visually present the reading proficiency rates and the significant gaps in reading proficiency across the Commonwealth. Dr. Michele Claibourn and Sam Powers created the Reading Outcomes and Equity in Virginia website, which provides multiple ways of viewing the English SOL data including:
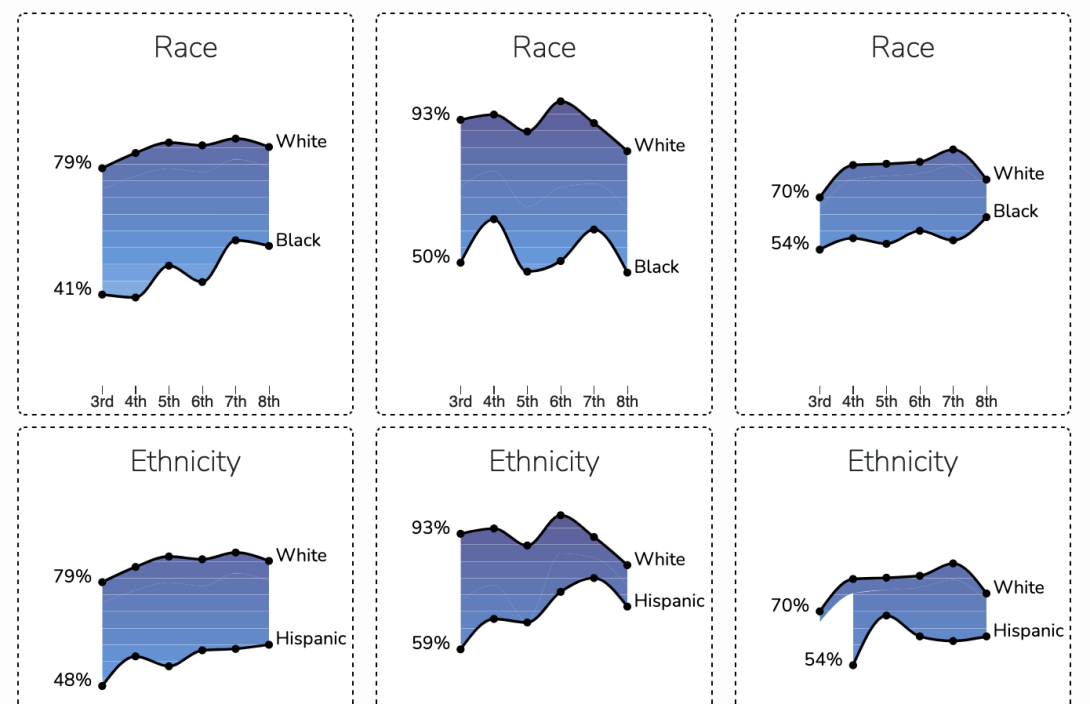
- estimating the overall SOL reading proficiency rates for students in grades 3-8 by school division and year, and graphing the gaps by socioeconomic status, race, and ethnicity to understand how gaps have changed over time;
- generating grade cohorts to visualize how reading proficiency changes over a student’s time in school and whether reading gaps are reduced or amplified during a child’s time in school;
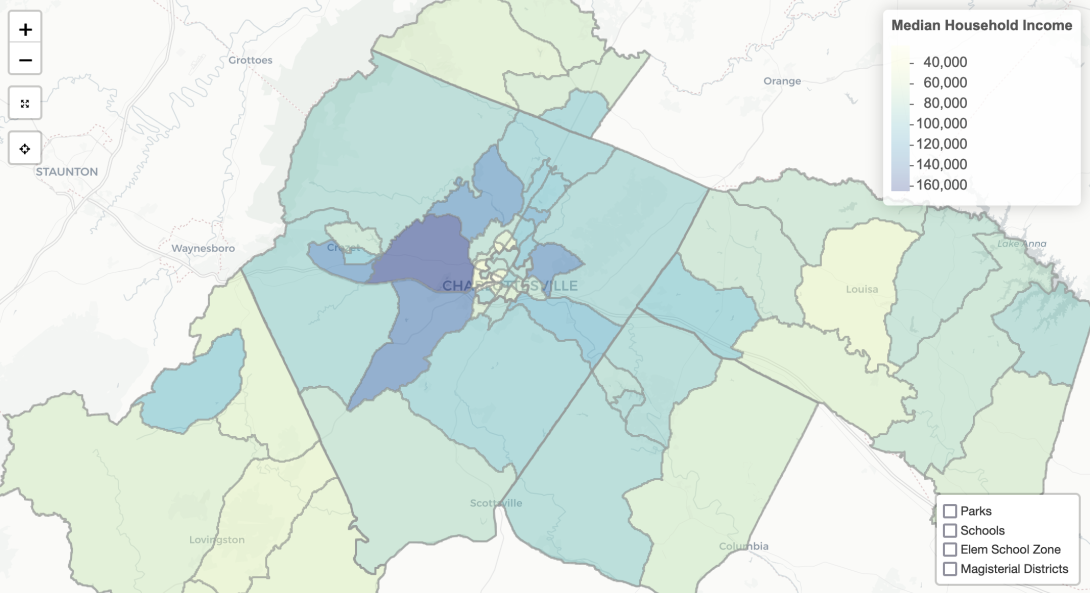
- presenting third grade reading and math SOL rates by school division over time to examine how the Commonwealth is faring in this critical milestone.
6
Mar
resource
Mar 6, 2024
Examine gaps in pass rates for Reading and Math SOL tests for VA school divisions.
virginiaequitycenter.github.io
6
Mar
Equitable Analysis
Equitable Analysis centers community-driven partnership to provide advocates as well as civic-and private-sector leaders with data and metrics, contextualized analysis, interactive maps and data visualizations, and narrative storytelling.